

A New Measure for the Country’s Housing Markets
Comparing the health of U.S. housing markets based on demand, supply and financial data
By Patrick Duffy
During these challenging times in the building industry, it’s understandable that builders and developers would be looking to rein in costs as much as possible, especially for data. That’s why it’s an opportune time to check out the free Housing Market Index interface recently unveiled by the U.S. News and World Report at https://realestate.usnews.com/housing-market-index/interface. It is designed to work on desktops and laptops, but not on tablets and phones.
Long known for their rankings covering everything from Best Places to Live to Best Colleges, the storied media company dating from 1948 has opted to also rank the country’s leading housing markets using a wide variety of variables. The concept of the index – and its subindexes – is to compare the health of U.S. housing markets with a single number indicating their relative health and resilience on a scale of 0-100.
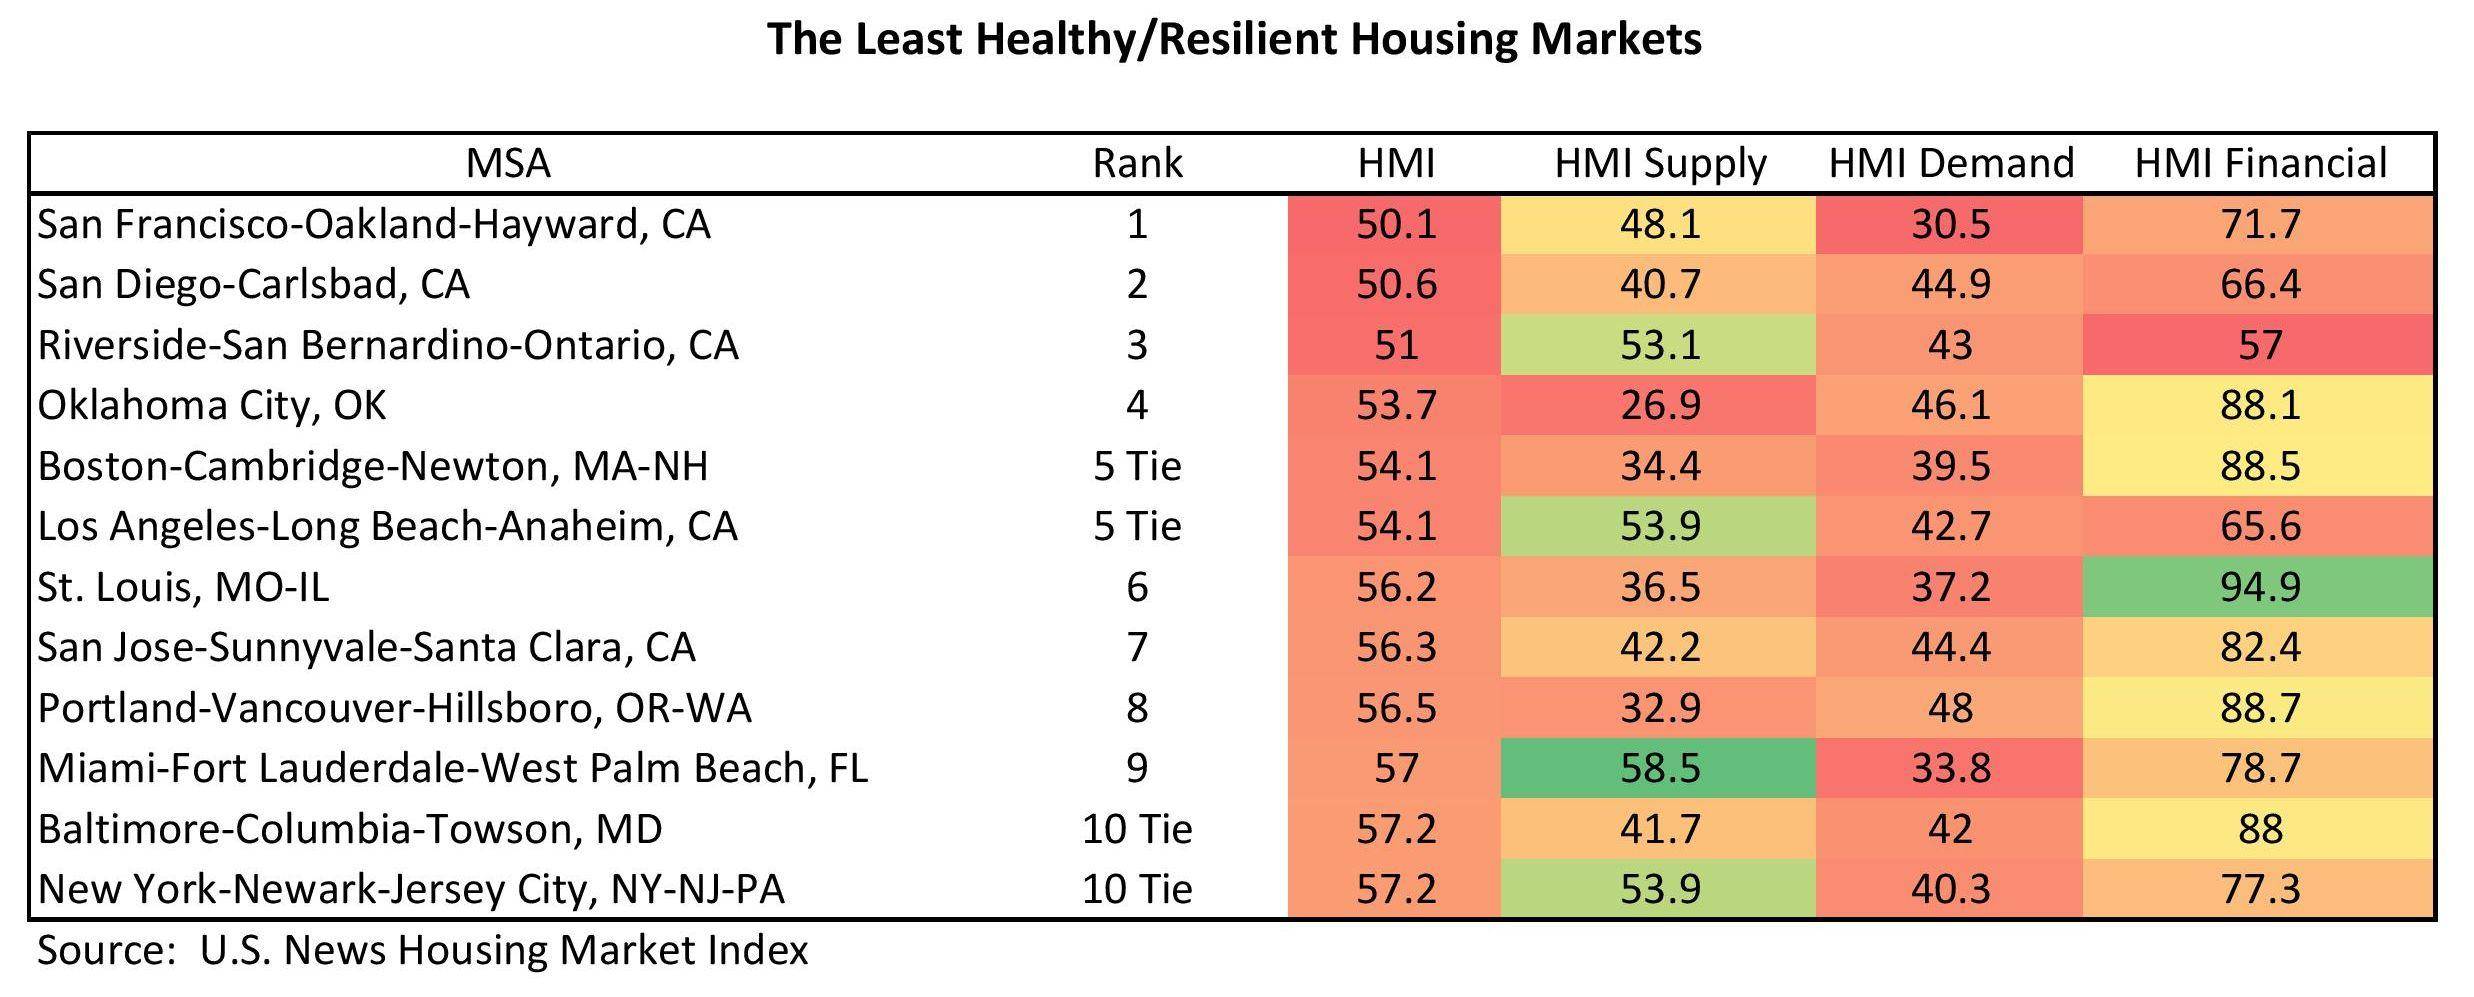
Not surprisingly, five of the top ten least healthy/resilient markets are located in the high-priced and under-supplied state of California…”
Although the index currently in beta testing includes just over 50 housing markets selected for their larger shares of new construction activity, over time it will likely be enhanced with more MSAs and data. The index is regularly updated towards the end of each month.
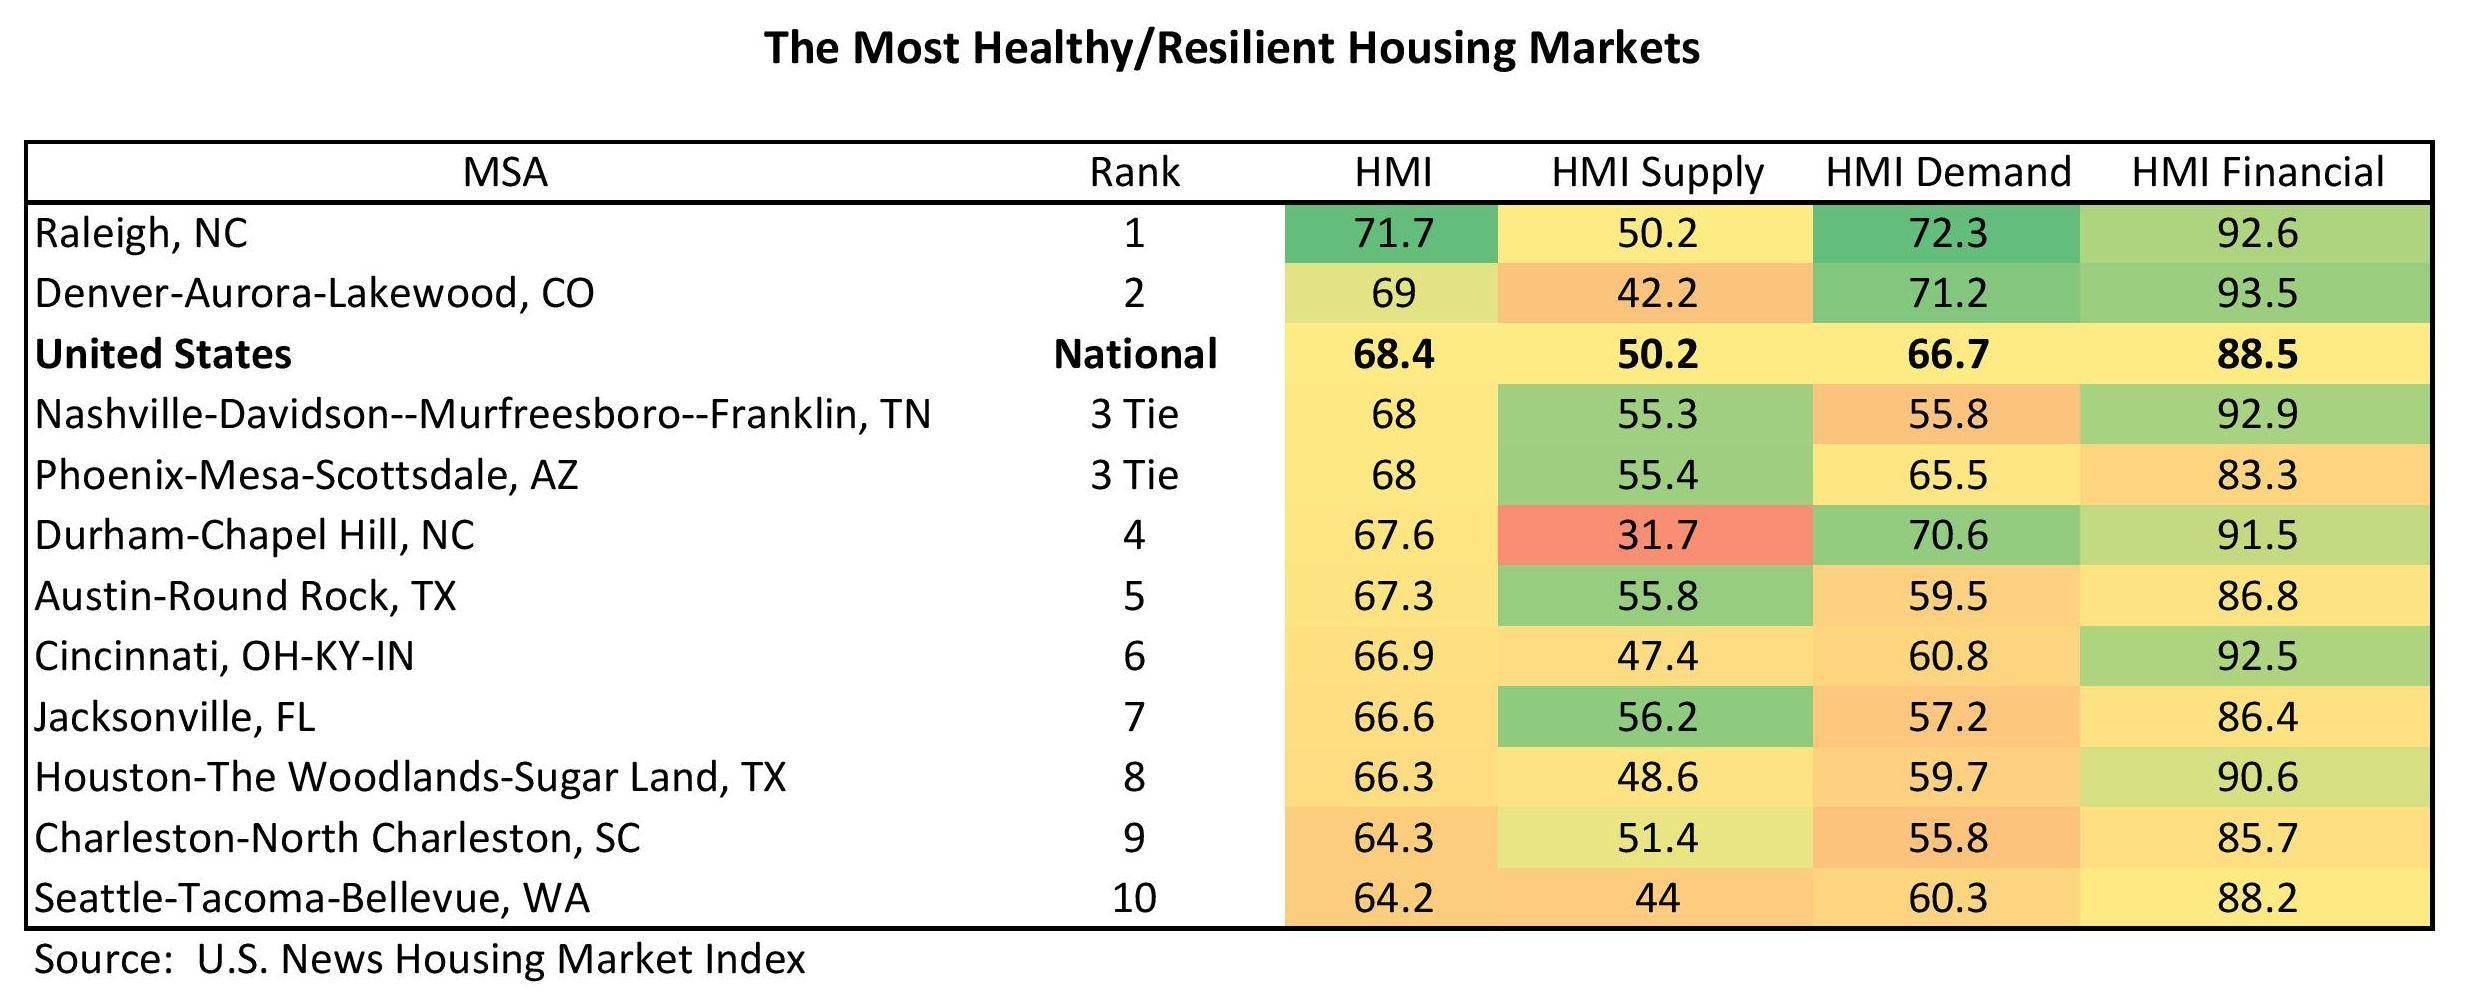
The three subindexes include those for demand, supply and financial data. The Demand HMI includes data on employment, unemployment, household growth, consumer sentiment, median home sales price and median asking rental rates. The Supply HMI includes data on housing supply, rental vacancy rates, construction costs, construction jobs, builder sentiment and architectural billings. The Financial HMI includes data on interest rates, access to credit, delinquencies, foreclosures and ratios of monthly mortgage and rental payments to per-capita incomes calculated by the index. For mortgage payments, the index assumes principal and interest for 30-year conforming loans with 20 percent down and no PMI or other costs.
Using data from November 2022, the accompanying table summarizes the top ten rankings for the most healthy/resilient housing markets. Interestingly, the only two MSAs with an HMI higher than the U.S. figure of 68.4 were Raleigh, N.C. (71.7) and Denver (69), both of which also scored high for housing demand and finances but less for supply. Other MSAs scoring relatively high but lower than the national index include Nashville, Tenn. (68), Phoenix (68) and Durham, N.C. (67.6).
Not surprisingly, five of the top ten least healthy/resilient markets are located in the high-priced and under-supplied state of California, led by San Francisco (50.1) and followed closely by San Diego (50.6) and Riverside-San Bernardino/Inland Empire (51). However, due to several factors including poor supply and demand, MSAs including Oklahoma City (53.7), Boston (54.1) and St. Louis (56.2) also made the list.
In addition to the HMI indexes, the interface is organized by sections including detailed graphical histories of various components for each subindex. If you’re looking for forecasts, the interface also provides histories and four-month projections for both single- and multi-family building permits. Finally, the interface harnesses the power of IBM Watson to track the sentiment of housing news in the media as well as the top-performing keywords and places for page views. Give it a try!
Patrick Duffy contributes as a Real Estate Economist for U.S. News & World Report and is the Founding Principal of MetroIntelligence.