

Housing Market Nuance
Major regional differences highlight the fluctuating nature of the homebuilding industry
 By Patrick Duffy
Last month, when I wrote about opportunities for homebuilding by states, it was apparent that the greatest total population gains between 2021 and 2022 were located in Texas, Florida and Arizona. Similarly, the largest gains by percentage were located in the same states plus Washington, Georgia and North Carolina.
More recently, despite constant predictions of national housing market collapses by some media outlets and individual influencers in search of their share of advertising revenue from online clicks, the truth is much more nuanced, and continues to show dramatic differences between geographic regions of the country.
For example, while national new single-family home sales for March rose 9.6% from February, they soared over 170% in the Northeast and rose 29.8% in the West but fell 5.4% in the South. Year-on-year, while national sales fell 3.4%, they were up 27.5% in the Northeast but down 9.0% in the West and 11.3% in the Midwest. What this likely meant is a rebound in demand in the Northeast as winter turned to spring and a slight cooling in the hottest markets of the South as builders catch up with orders.
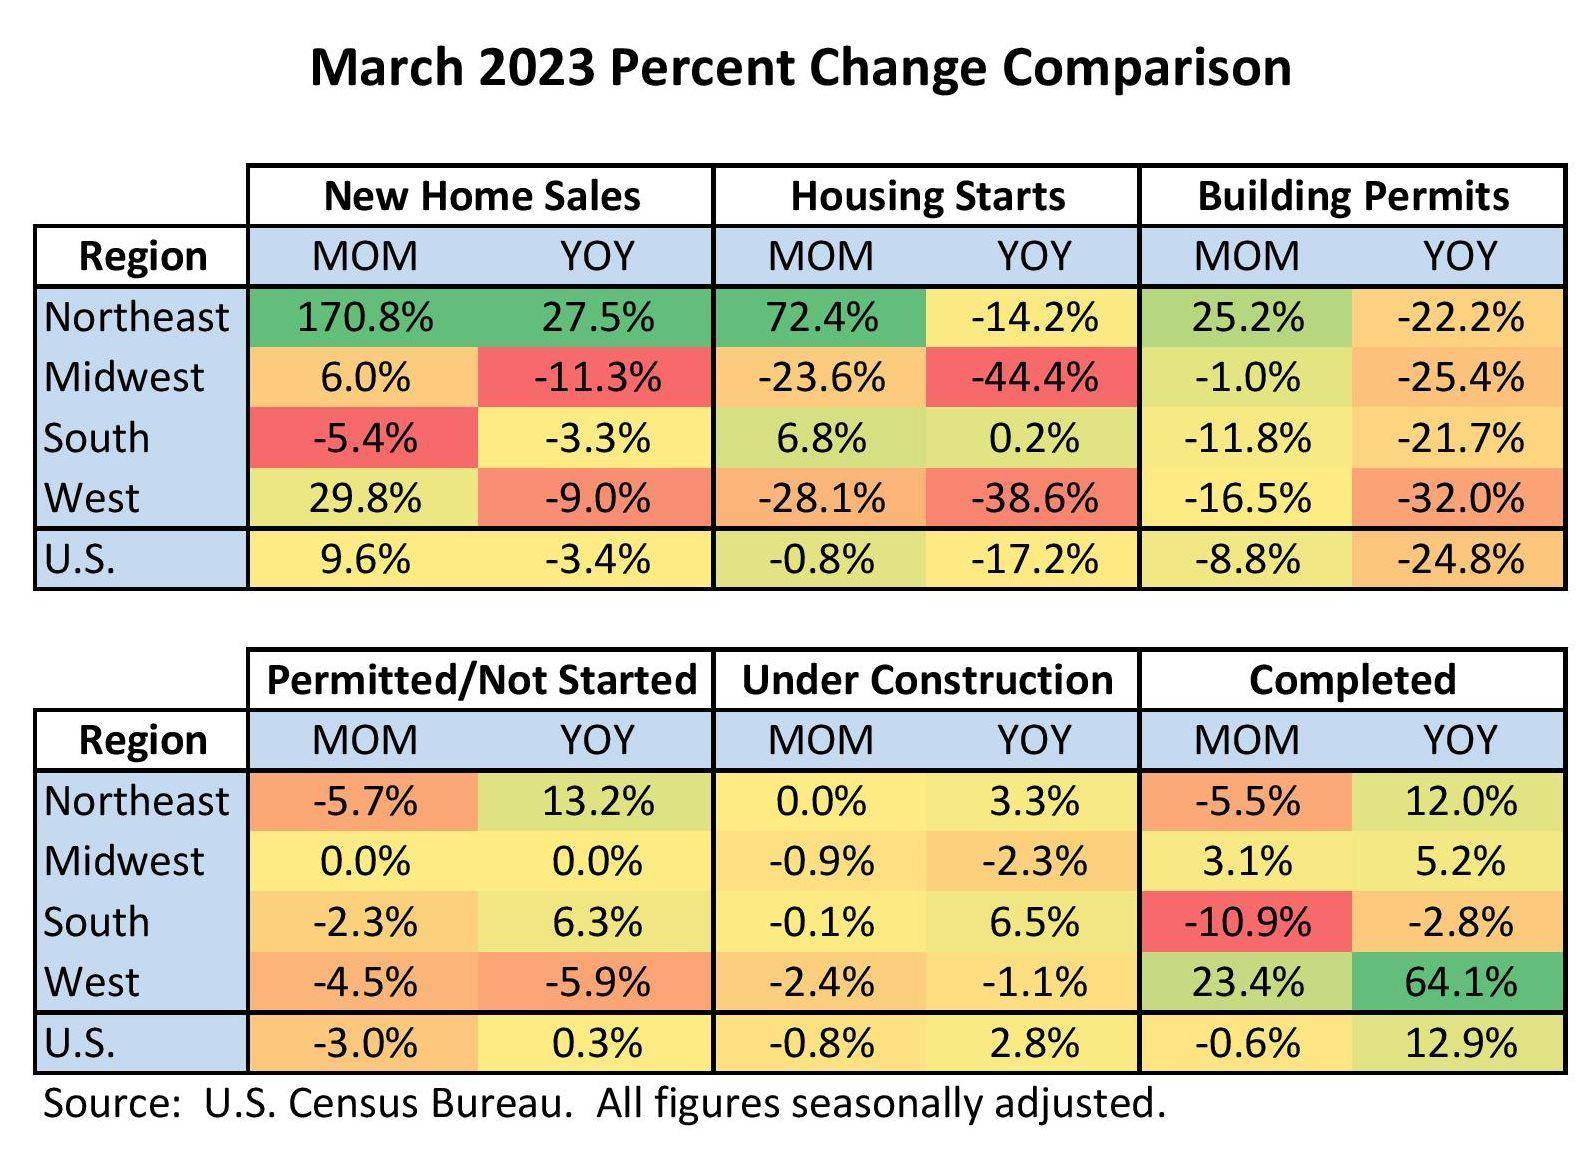
With new home sales jumping so fast in the Northeast, it’s not surprising to see housing starts there jumping over 72% while building permits rose over 25% between February and March. Meanwhile, in the West starts fell 28.1% and permits fell 16.5% during the same time period. Not surprisingly, in the West that’s partly due to a jump in the number of completed units of 23.4% since February and over 64% year-on-year.
For now, the number of units under construction nationally is holding somewhat steady, falling 0.8% since February and flat in the Northeast and the South. Similarly, the number of units with permits but not yet started are also somewhat steady, falling 3.0% from February and mostly flat year-over-year.
On a national level, the market has cooled considerably from its pandemic-era heights largely due to owners with mortgages choosing to remain in place rather than to test their luck with higher lending rates, which has limited inventory. To be sure, while new homes have taken up an increasing share of overall sales, the successful deployment of robust incentives and discounts have steadily whittled away at standing inventory, putting more pressure on existing home listings. As of March 2023, the inventory of unsold homes at current sales rates fell to 7.6 months – down from the most recent peak of 10.1 months last fall and the lowest in a year. For buyers, as builders run out of inventory, look for these incentives and discounts to disappear, especially if mortgage rates decline below 6.0%.
Sales prices are also holding firmer and even rising in some cases. The median sales price of new houses sold in March 2023 was $449,800, up 3.8% from February and 3.2%year-on-year. The average sales price performed even better, up 12.1% from February and 9.9% year-on-year to $562,400.
For existing homes, median home sales prices rose 3.3% between February and March to $375,700 after potentially hitting a trough of $361,200 in January, and are down just 0.9% year-on-year. However, over the year they did rise in the Midwest (1.7%), the Northeast (1.0%) and the South (0.3%) but fell in the West (-7.5%). If there’s a further national housing price correction in store, the data has yet to prove it.
Patrick Duffy contributes as a Real Estate Economist for U.S. News & World Report and is the Founding Principal of MetroIntelligence.